At our 2/22/2011 meeting, I gave a 10-minute talk about my project to use Microsoft Excel® and Visual Basic for Applications® (VBA) to analyze property tax data in Dutchess County. Following is a synopsis.
I've captured Dutchess County's municipal property tax data in an Excel spreadsheet, and am analyzing it using VBA macros to automatically generate tables and charts.
The Dutchess County Real Property Tax Service Agency publishes pamphlets of property tax data, one for each year. Each pamphlet contains the assessed value and tax levy for each of approximately 250 municipal jurisdictions and segments in Dutchess County (towns, cities, villages, School districts, fire districts, and other special districts). This is about 500 individual pieces of data per year. I've copied this data for each year of the current millenium into an Excel spreadsheet. So the spreadsheet contains over 5,000 independent pieces of data.
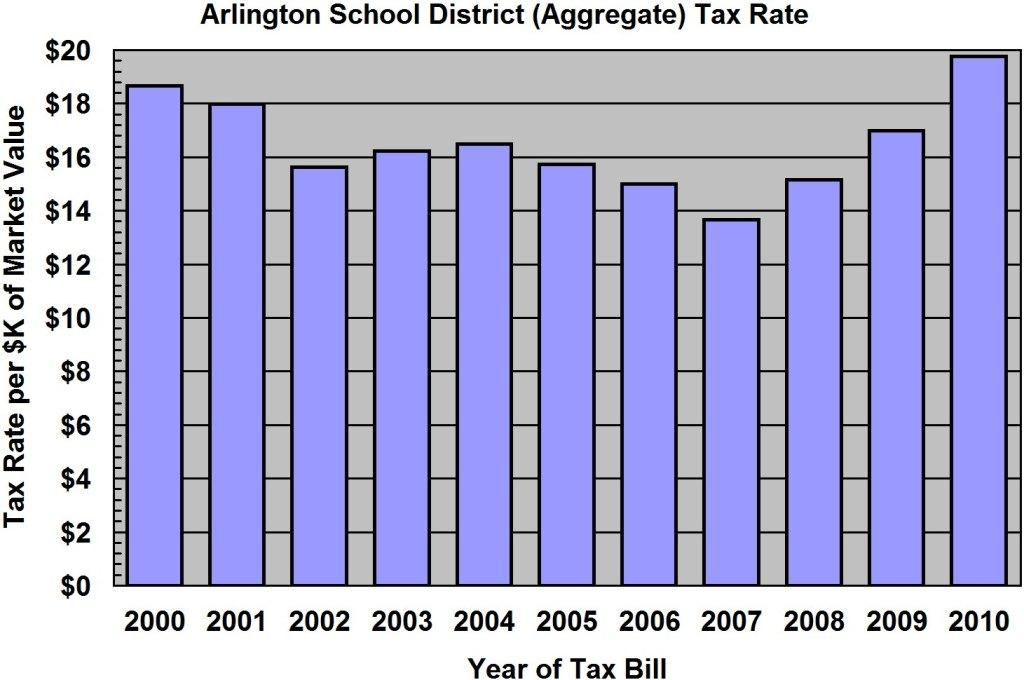
I've written a bunch of Excel macros in VBA to analyze this data, analysis of the kind that I had previously done in Excel “by hand”. The macros create new Excel workbooks automatically and fill them with tables of tax data. Then they create charts from the tables. A typical chart is shown below.
The VBA language, a variant of Visual Basic®, which is itself a dialect of BASIC, isn't pretty. One of the most annoying aspects I found is the assignment statement syntax. Scalar assignment is done in the normal way, but object assignment must be done using the “set” keyword. Usually, the compiler tells you if you've made a mistake. OK, that's not too bad. But in some cases, the same assignment can validly be written either with or without the “set” keyword and each means a different thing. I can't tell you how often I've messed this up, and spent a lot of time trying to figure out what went wrong.
The VBA language in Excel is very powerful. I was pleasantly surprised to find that essentially anything I could do “by hand” can be programmed with a macro, thanks to a very rich object model of Excel. Because of certain Excel idiosyncrasies, the generation of charts isn't always perfect, and I occasionally still need to touch up some charts by hand. This is because the Excel chart-making algorithms make certain esthetic decisions that I occasionally disagree with, and that cannot be detected automatically.
Much to my surprise, I didn't find any official VBA documentation from Microsoft, at least any that was at all useful. And I didn't find any other single source of good, comprehensive documentation. On the other hand, a great deal has been written on the web about VBA. This has been the only way I could figure anything out. What worked for me was to google “Excel VBA ...”, where “...” is whatever I was interested in understanding. Invariably, the first few hits gave me what I wanted. There seem to be about half a dozen clear, reliable sources of partial documentation of VBA.
Following is a typical output chart generated automatically from my macros: